Bramvia — Business Central Experts
Buffer inventory: meaning, formula and worked examples (with the mistakes that make buffers cost more than stockouts)
Buffer inventory (safety stock) is the extra stock held to absorb demand spikes and late deliveries. The definition, the standard formula with Z-scores, three worked examples for a distributor, a manufacturer and a European importer, how it differs from cycle stock, and how to size it without freezing cash.
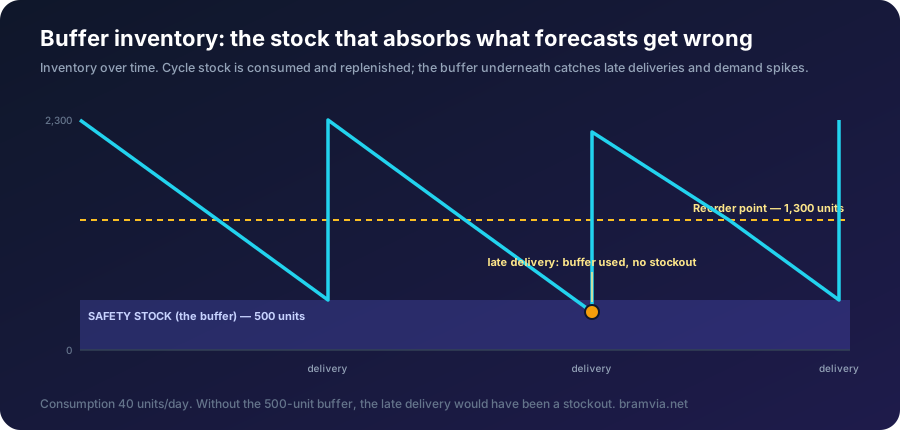
Short answer: buffer inventory — also called safety stock — is the quantity of an item you hold on top of what you expect to sell or consume before the next delivery, so that a demand spike or a late supplier doesn't become a stockout. Cycle stock is the part that goes up and down with each delivery; the buffer is the floor underneath it. Its size depends on three things: how variable demand is, how variable and long the supplier's lead time is, and how much stockout risk you accept. The standard formula is Safety stock = Z × σ × √(lead time), where Z is the service level you choose (1.65 for 95%, 2.05 for 98%). Below: the definition properly, the formula with every term explained, three worked examples, and the two mistakes — sizing buffers on the wrong lead time and never revisiting them — that make buffers cost more than the stockouts they prevent.
Definition
Inventory of any item splits into two parts:
- Cycle stock: what you consume between one delivery and the next. It's replenished each time you reorder, so it rises to the order quantity and falls to (ideally) zero.
- Buffer inventory / safety stock: a fixed extra quantity held permanently. You don't plan to use it; it's there for the weeks when demand runs above forecast or the supplier delivers late.
The reorder point is where the two meet: when stock falls to expected demand during lead time + buffer, you order. If everything goes to plan, the delivery arrives just as you reach the buffer. If it doesn't, the buffer carries you.
Two things buffer inventory is not: it isn't dead stock (items nobody consumes), and it isn't strategic stock hoarded for a price rise. It's a calculated cushion against variability.
The formula
Safety stock (SS) = Z × σ_demand × √(Lead time in days)
Reorder point (ROP) = (Average daily demand × Lead time in days) + SS
Where:
- Z — the service-level factor from the normal distribution: how often you're willing to stock out.
- 90% service level → Z = 1.28
- 95% → Z = 1.65
- 98% → Z = 2.05
- 99% → Z = 2.33
- σ_demand — the standard deviation of daily demand over the last 6-12 months (a spreadsheet function on your sales history).
- Lead time — the supplier's actual delivery time in days, measured from your receipts, not the number in the vendor card.
When lead time also varies (it usually does), the fuller version:
SS = Z × √( (Lead time × σ_demand²) + (Average demand² × σ_leadtime²) )
It looks worse than it is: the second term just adds the lead-time variability. If your supplier delivers anywhere between 20 and 50 days, that term dominates and the simple formula under-sizes the buffer badly.
Worked example 1 — a distributor
An industrial distributor sells a bearing at 40 units a day on average, with daily demand σ = 12. The supplier's actual lead time is 45 days. They want a 95% service level.
SS  = 1.65 × 12 × √45 = 1.65 × 12 × 6.71 = 133 units
ROP = (40 × 45) + 133 = 1,800 + 133 = 1,933 units
At 40/day, a 133-unit buffer is about three days of cover — enough to absorb a demand spike or a delivery a few days late. Reorder when stock hits 1,933.
Worked example 2 — a manufacturer's component
A component is consumed at 200 a day, σ = 60, from a supplier whose lead time averages 10 days but varies with σ = 3 days. Service level 98% because a stockout stops the line.
SS  = 2.05 × √( (10 × 60²) + (200² × 3²) )
    = 2.05 × √( 36,000 + 360,000 )
    = 2.05 × 629 = 1,290 units
ROP = (200 × 10) + 1,290 = 3,290 units
Notice what the lead-time variability did: the demand term is 36,000, the lead-time term is 360,000 — ten times larger. For this part, the buffer exists mainly because the supplier is unreliable, not because demand is. Fixing the supplier (or dual-sourcing) would shrink the buffer more than any demand forecast could.
Worked example 3 — a European importer, 2026
A Spanish distributor imports a product from Asia. Pre-2025, lead time was 35 days, steady. Through 2025-2026, with freight disruption, tariffs rerouting supply and diesel at record levels, actual lead times ran 35-70 days, average 50, σ = 12. Demand 25 a day, σ = 8. Service level 95%.
Old buffer (35 days, stable):  1.65 × 8 × √35 = 78 units
New buffer (50 days, σ 12):    1.65 × √( (50 × 64) + (625 × 144) ) = 1.65 × √(3,200 + 90,000) = 1.65 × 305 = 504 units
The buffer had to grow from 78 to 504 units — six times — and the reorder point from 953 to 1,754. That is exactly what happened across Europe: 63% of manufacturers raised safety stock over the last two years, and they were right to. The question is whether they calculated it or guessed, and whether they'll bring it back down when lead times normalise.
Buffer inventory versus related terms
| Term | What it means | How it differs from buffer |
|---|---|---|
| Safety stock | Same thing | Same thing — the terms are interchangeable |
| Cycle stock | Stock consumed between deliveries | The moving part; the buffer is the floor |
| Reorder point | Stock level that triggers an order | = demand during lead time + buffer |
| Dead stock | Items with no consumption for 12+ months | Not a buffer; it's a mistake that stayed |
| Strategic / anticipation stock | Stock built for a known event (price rise, seasonal peak) | Planned and temporary, not a cushion for variability |
| Decoupling stock | Buffer between two production stages | A buffer, but internal — between machines, not against suppliers |
The two mistakes that make buffers expensive
1. Sizing on the vendor card, not on actual receipts. The card says 28 days. Receipts say 45, with a spread. Buffers built on 28 are wrong by design, and the company either stocks out or, more often, adds a "just in case" quantity nobody calculated — which is how buffers become dead stock.
2. Never revisiting. A buffer set in 2022 for a supplier who has since improved (or worsened) is wrong in both directions. Recalculate quarterly from the last 12 months of receipts and demand. It's a query, not a project.
The cost of getting it wrong compounds: each extra unit in the buffer carries 20-30% of its value a year in capital, storage, insurance and obsolescence. On a €600,000 increase in buffers that's €120,000-180,000 a year. Worth it against stockouts — if it was calculated. How companies free that cash without hurting service.
How to do this in an ERP instead of a spreadsheet
Modern ERPs compute it. In Business Central, the item card carries safety stock quantity, reorder point, lead time and the reordering policy, and planning suggests orders when stock crosses the reorder point. What most companies don't do is feed the parameters from actuals — so a quarterly review that recalculates σ and lead time from receipts and updates the item cards is the single highest-return inventory task there is. We build it as a report and a batch update; it takes an afternoon to set up and runs itself.
FAQ
Is buffer inventory the same as safety stock? Yes. Different textbooks, same concept.
What service level should I use? 95% for most items; 98-99% for items where a stockout stops production or loses a key customer; 90% or lower for slow C-class items where the carrying cost outweighs the occasional stockout.
How often should I recalculate? Quarterly, from the last 12 months of actual receipts and demand. After any supplier change, immediately.
Does the formula work for seasonal items? Use the σ of the relevant season, not the whole year — or a forecast-error-based method. The annual σ overstates the buffer in the low season and understates it in the peak.
We're in Europe; does anything differ? The maths is the same. What differs in 2026 is that lead times from Asia and the US have become longer and more variable, so the lead-time term in the formula matters more than it did — which is why buffers across Europe have grown.
Free assessment · Evaluación gratuita
Tell us your current system and how many users you have. First reply within one working day. / Cuéntanos tu sistema actual y cuántos usuarios sois. Respondemos en un día laborable.
Buffers set years ago and never recalculated? Free assessment, no commitment — we'll recompute them from your actual receipts and show you what's over and under.