Bramvia — Business Central Experts
Diesel at $5.90: routes, mileage and expenses are now a margin line — and your ERP should be managing them
With diesel at a record $5.90 a gallon and fuel surcharges up ~300%, the cost of moving people and goods is no longer a rounding error. What companies with vehicles, field teams or deliveries should be tracking — route planning, mileage capture, expense control, fuel surcharge recovery — and how it connects to the ERP instead of living in receipts and spreadsheets.
Short answer: with diesel at an all-time US record of $5.90 a gallon (September 2026) and fuel surcharges up roughly 300%, the cost of every delivery, every service call and every sales visit moved from "overhead" to "a line that decides margin". Most mid-market companies still manage it with receipts in a drawer, mileage on a form, and routes planned by whoever is driving. Four things change that: route planning that groups stops by geography and time window, mileage captured automatically by vehicle and job, expense capture with an approval agent instead of a monthly envelope, and fuel surcharge recovery built into pricing rather than absorbed. None of this needs a separate fleet platform for a fleet under 50 vehicles — it belongs in the ERP, against the job, the customer and the vehicle, so you can finally see what a delivery to that customer actually costs.
Where the money goes now
| Cost | What changed | What it does to margin |
|---|---|---|
| Fuel | $5.90/gal diesel, vs ~$3.50 forecast entering the year | A 200-mile round trip costs $70 more than it did in January |
| Freight surcharges | Up ~300%; fuel share of carrier cost per mile from ~21% to 28% | Every inbound and outbound shipment repriced upward |
| Truckload rates | +15% year on year, +$0.30 per mile | Carrier invoices exceed what was quoted |
| Field service visits | Same trip, higher fuel, same flat fee to the customer | Service margin quietly compressed |
| Expense claims | More receipts, larger amounts, same manual review | Errors and duplicates scale with volume |
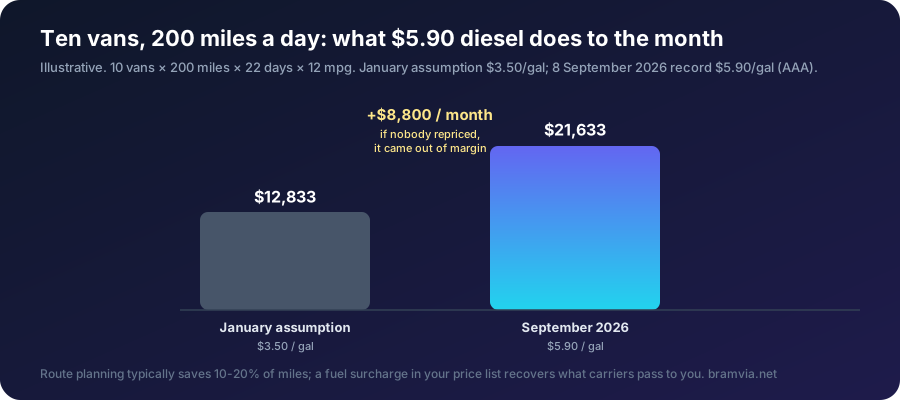
If you have a fleet of ten vans running 200 miles a day each at 12 mpg, the fuel delta alone is roughly $8,800 a month over January's $3.50 assumption. If nobody repriced, that came out of margin.
The four things to fix
1. Route planning that isn't "whoever's driving decides." Group stops by geography and time window, sequence them to minimise miles, and assign to vehicles by capacity and what's already loaded. For under 50 vehicles this is a planning screen fed by today's orders — not a $50,000 fleet platform. The saving is typically 10-20% of miles, which at $5.90 is real money, plus one more stop per driver per day.
2. Mileage captured, not remembered. Per vehicle, per job, per customer — from the vehicle's odometer or the driver's phone, posted against the delivery or the service order. This is what turns "we spent $28,000 on fuel" into "customer X costs $340 a month to serve and is on a $290 margin." Business Central 29's Expense Agent now handles mileage by date and vehicle type with automatic calculation, and its travel requests cover multi-person trips — what's new in 29.
3. Expenses with an agent, not an envelope. Receipts photographed and captured, policy checked automatically (over-limit meals flagged, duplicates detected even against already-posted claims), approver assigned, posted to the job. The BC29 agent also detects the receipt submitted twice in different months — which is the leak most companies never find.
4. Fuel surcharge in your pricing. If carriers charge you a surcharge indexed to diesel, your delivery pricing should carry one too. It is a price-list rule in the ERP, indexed monthly, transparent to the customer — and it stops your margin absorbing what your suppliers pass through.
What you can see once it's in the ERP
- Cost to serve by customer, including delivery miles and service visits — the number that reveals which "good" accounts are margin-negative once you drive to them.
- Cost per stop and per mile by vehicle — which van is expensive, which driver takes the long way.
- Expense trend by employee and category — before it becomes a conversation.
- Surcharge recovered vs surcharge paid — the gap is what you're absorbing.
This is the same logic as finding margin leaks, applied to wheels.
What we'd build for you
For companies where this is a real line — distributors with their own fleet, field service companies, contractors with crews — we build it as an extension on Business Central: a route planning board fed by open orders and service calls, mileage and stop capture from a phone, automatic posting against the job and vehicle, and the cost-to-serve report on top. It sits alongside the Expense Agent for receipts and approvals, and it stays inside the ERP — no third platform, no integration to maintain, one number for what a customer costs.
If your fleet is 100 vehicles with telematics, a dedicated platform integrated by API is the right answer and we'll say so. Below that, the ERP is enough and it's cheaper.
The formulas we use
Fuel cost per mile
Fuel cost per mile = Price per gallon ÷ Miles per gallon
Example: $5.90 ÷ 12 mpg = $0.49 per mile. In January at $3.50: $0.29. The delta is $0.20 on every mile you drive.
Fully loaded cost per mile
Cost per mile = (Fuel + Maintenance + Insurance + Depreciation + Driver wages) ÷ Miles driven
For a light commercial van in 2026 this typically lands between $1.10 and $1.60 per mile — the number that should be in your delivery pricing.
Cost to serve a customer
Cost to serve = (Deliveries × Round-trip miles × Cost per mile) + (Service visits × Visit cost) + Order handling
Customer net margin = Contribution margin − Cost to serve
Example: a customer with $290 monthly margin, served with 6 deliveries of 40 round-trip miles at $1.40 → 6 × 40 × 1.40 = $336 cost to serve → net −$46 a month. Profitable on the invoice, negative on the road.
Fuel surcharge to pass through
Surcharge per mile = (Current diesel price − Baseline price in your rate) ÷ Miles per gallon
Surcharge % = Surcharge per mile ÷ Base rate per mile
Example: ($5.90 − $3.50) ÷ 12 = $0.20 per mile; on a $1.40 base rate that's a 14% surcharge. Index it monthly and it stops coming out of margin.
Route saving
Miles saved = Miles on current routes − Miles on optimised routes
Monthly saving = Miles saved × Cost per mile
10-20% of miles is typical on routes that were never re-sequenced; on 44,000 monthly miles at $1.40, that's $6,000-12,000 a month.
FAQ
We already use a fuel card — isn't that tracking? It tracks what you spent, by card. It doesn't tell you which customer, job or route it went to, and that's the number that changes decisions.
Our drivers won't use an app. They use the one for the fuel card. One more tap at each stop is a smaller change than a paper log, and it stops the Friday reconstruction of the week's miles.
Does route planning help if our stops are the same every day? Yes — fixed routes drift. Re-sequencing a "standard" route against current stops typically recovers miles nobody noticed adding.
What about tolls, parking, per diems? Expense categories with policy rules. The agent handles them like any other receipt, and they post to the job.
Fleet, field team or deliveries — and fuel eating the margin? Free assessment, no commitment — we'll show you what a delivery to your top ten customers actually costs.