Bramvia — Business Central Experts
The 13-week cash forecast: the one report a CEO should see every Monday, and why most companies can't produce it
Profit is an opinion; cash is a fact. The 13-week cash forecast is the report that tells a CEO whether payroll clears in week 9 — and most mid-market companies can't produce it because the inputs live in five places. What it is, where each line comes from, and how to make it a Monday habit instead of a quarterly panic.
Short answer: the 13-week cash forecast is a rolling weekly view of cash in, cash out and closing balance for the next quarter. It is the report that answers the only question that ends companies: will we have the cash in week 9? Lenders ask for it, PE sponsors require it, and a CEO who has it stops being surprised. Most mid-market companies can't produce it reliably — not because it's hard, but because the inputs live in five places: receivables in the ERP, payables in inboxes, payroll with a provider, debt in a spreadsheet, and the big customer's promise in a phone call. The fix is getting those five into one system so the forecast is a query, not a Sunday-night assembly job.
Why 13 weeks
Long enough to see a problem coming and act — renegotiate a payment, chase a receivable, delay a purchase. Short enough that the inputs are real: open invoices, known payroll dates, scheduled loan payments, orders already on the books. Beyond a quarter it becomes a budget; inside a quarter it is operations.
And weekly, not monthly, because cash doesn't fail on the 30th. It fails on the Thursday payroll runs and the receivable everyone assumed would land on Tuesday.
What's on it
| Line | Where it comes from | Where it usually lives today |
|---|---|---|
| Opening cash | Bank balances | Bank portals, reconciled late |
| Receipts: open receivables by due date | AR ledger, with the actual payment behaviour per customer, not the terms | ERP, but with terms not behaviour |
| Receipts: orders not yet invoiced | Sales orders with expected ship dates | ERP, or the sales team's heads |
| Payments: open payables by due date | AP ledger | Half in the ERP, half in inboxes |
| Payments: purchase orders not yet invoiced | Open POs with expected receipt | ERP — if POs exist |
| Payroll and taxes | Payroll provider calendar | A spreadsheet somebody maintains |
| Debt service, leases, rent | Loan schedules | Another spreadsheet |
| Capex and one-offs | Approved projects | |
| Closing cash | The arithmetic | — |
Notice the pattern: the two most important lines — receipts and payables — depend on the ERP having due dates that reflect reality. A customer on 30-day terms who pays at 58 should be forecast at 58. That is a data point the system has, if anyone looks.
Why companies can't produce it
Payables aren't in the system until they're paid. Invoices sit in inboxes for approval. The forecast can't see them. AP automation fixes this as a side effect: capture on arrival means the liability is visible from day one.
Receivables are forecast on terms, not behaviour. The ERP says net 30; the customer pays at 60. The forecast is wrong by a month on your largest line. The fix is a per-customer average days-to-pay, which any modern ERP can compute.
No purchase orders. If purchasing happens by phone, committed spend is invisible until the invoice arrives. This is the same discipline that makes AP automation and quote-to-actual costing work — it's the foundation for all three.
Assembly by hand. Someone exports five reports on Sunday, pastes them into a template, adjusts, and sends it Monday morning. It's late, it's inconsistent, and the week it doesn't happen is the week it mattered.
Making it a Monday habit
- Get payables in on arrival, not on approval. Capture first, approve later — the liability exists either way.
- Set customer payment behaviour in the system: expected days-to-pay per customer, updated quarterly from actuals.
- Require POs above a threshold so committed spend shows up before the invoice.
- Put payroll, debt and leases in as recurring entries with dates. Once, then forget.
- Build the forecast as a report, not a spreadsheet. In Business Central the cash flow forecast pulls AR, AP, orders, POs and manual entries into one view, and Power BI turns it into a chart the CEO can read in ten seconds.
- Compare last week's forecast to what actually happened. The gap is the education — usually one customer or one supplier explains most of it.
After three or four cycles, the forecast is trusted. After that, the Monday meeting changes: it stops being "what happened" and starts being "what do we do about week 7".
What it changes for a CEO
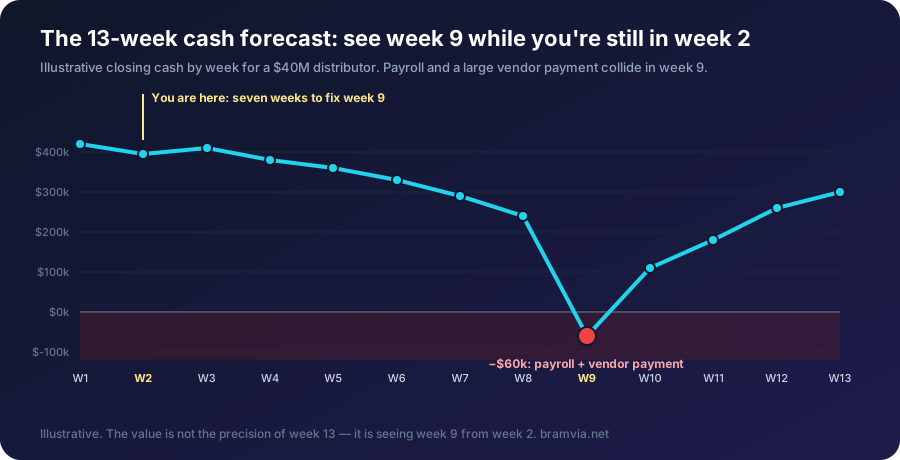
- Payroll stops being a surprise. You know in week 2 that week 9 is tight, and you have seven weeks to fix it.
- Collections get targeted. The forecast shows which three customers' payments would close the gap. Sales calls them, not accounting.
- Purchasing gets timed. The big material order moves a week, on purpose, instead of the bank call.
- Lenders relax. A company that produces a 13-week forecast every Monday gets better terms than one that produces it when asked.
The formulas we use
Closing cash, per week
Closing cash (week n) = Opening cash (week n) + Receipts (n) − Payments (n)
Opening cash (week n+1) = Closing cash (week n)
Expected receipt date — behaviour, not terms
Expected receipt date = Invoice date + Customer average days-to-pay
Average days-to-pay = Σ (days from invoice to payment × amount) ÷ Σ amount   (last 12 months, amount-weighted)
Example: terms are net 30; the customer's weighted average over the last year is 58 days. Forecast the $120,000 invoice dated 1 September for 28 October, not 1 October. On a $40M company this single correction typically moves $300,000-800,000 between weeks.
DSO and the gap that costs you cash
DSO = (Accounts receivable ÷ Revenue for the period) × Days in period
DSO gap = DSO − Agreed terms
Cash tied up by the gap = (Revenue ÷ Days) × DSO gap
Example: $40M revenue, $6.1M receivables → DSO = 6.1 ÷ 40 × 365 = 56 days. Terms are 30 → gap of 26 days → $2.85M of your cash funding customers. Good: gap under 10 days. Act: gap over 20.
Forecast accuracy — the number that builds trust
Weekly forecast error = |Forecast closing cash − Actual closing cash| ÷ Actual closing cash
Target: under 5% for weeks 1-4, under 15% for weeks 5-13. Track it; the customer or supplier that explains most of the error is your next fix.
FAQ
We're profitable — do we need this? Profitable companies run out of cash routinely: growth, inventory build, a large customer paying late. Profit is the P&L's opinion; the forecast is the bank account's.
Can our accountant do it? Your accountant reports the past. This is a forward view from operational data, and it needs the ERP to hold the inputs. Once it does, anyone can run it.
How accurate does it need to be? Weeks 1-4 should be tight. Weeks 5-13 are directional. The point isn't precision — it's seeing week 9 in week 2.
What if our ERP can't produce it? Then the inputs aren't in it, and that's a finding worth more than a new report. Our Profit Leak Audit works from your data on any system and will show you which lines are missing.
Want the 13-week forecast running from your own numbers? Free assessment, no commitment — we'll tell you which inputs you have and which you're missing.